
The SIPAmetrics platform · Part of PEI

Private markets benchmarks, in one platform.


infraMetrics®, privateMetrics® and privateAlpha™ — indices, valuation comparables and fund alpha for infrastructure and private equity — in a single interface. Dashboards, exports, custom benchmarks and factor pricing sit on the same data the indices are built from.

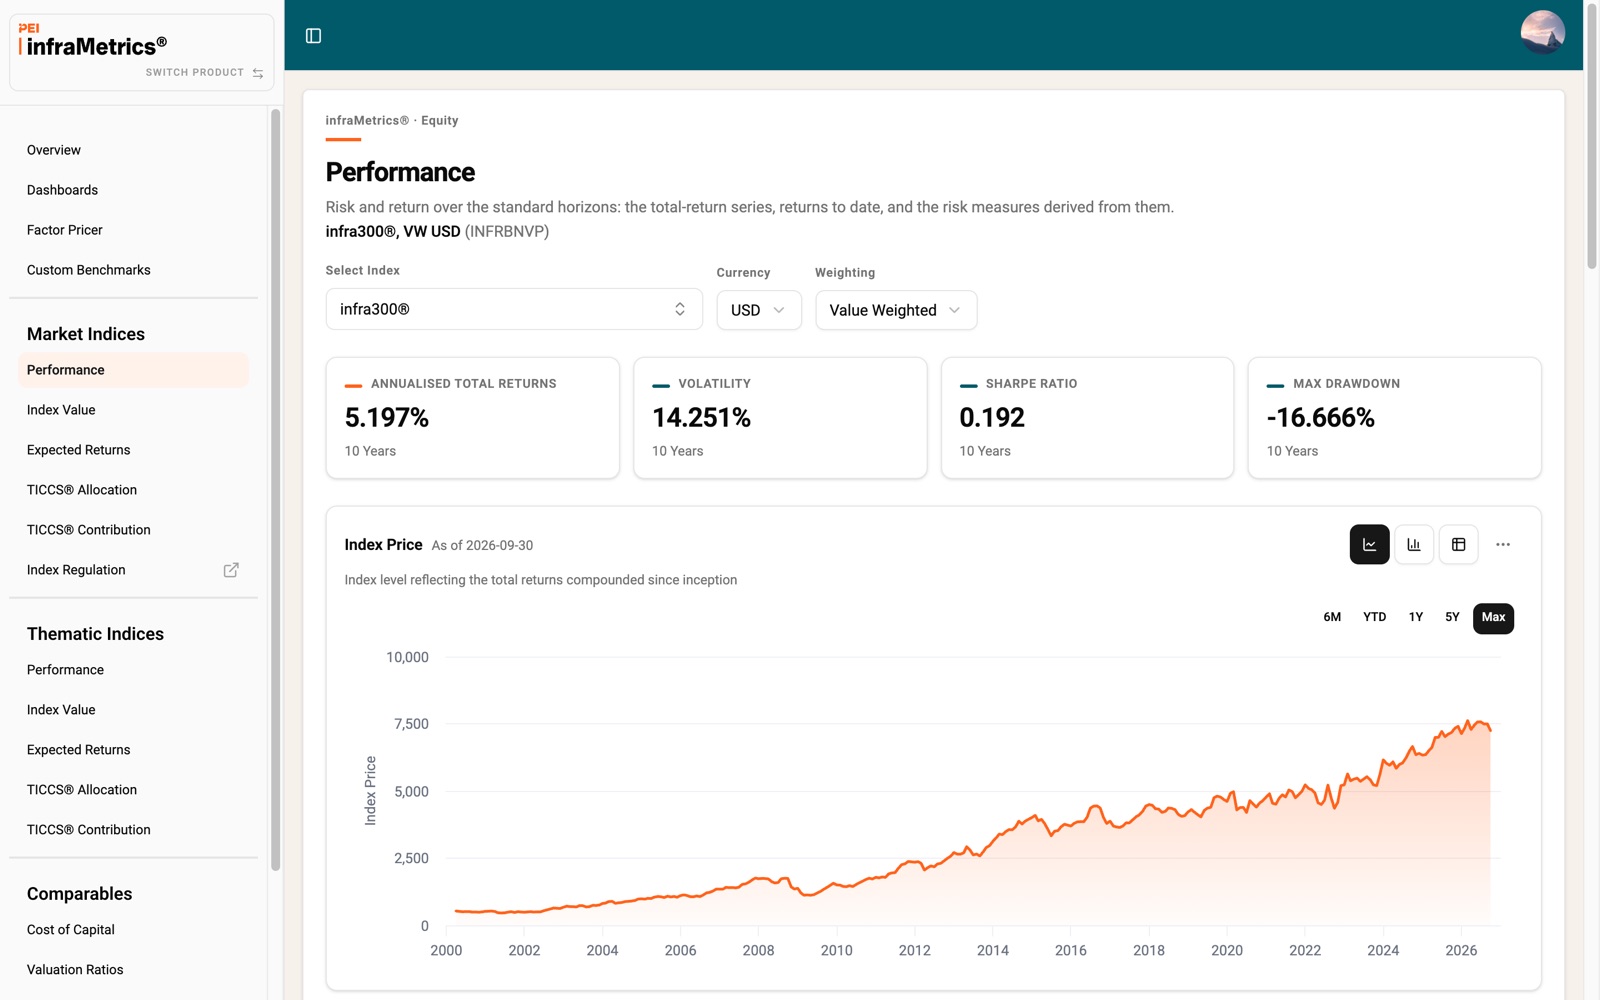
pei.private-alpha.com/inframetrics/performance
infraMetrics® Performance page for infra300®, showing annualised return, volatility, Sharpe ratio, max drawdown and the index price since 2000
1,551
infraMetrics® index families, equity and debt
330
privateMetrics® index families across 22 geographies
2,000+
buyout funds scored by privateAlpha™
ESMA
Registered benchmark administrator in the EU
LiveinfraMetrics®
LiveprivateMetrics®

The products

Four products. One asset universe, one taxonomy, one platform.

Each product opens on its own overview and switches from the logo in the sidebar. Indices, comparables and fund rankings are built from the same asset-level data, repriced monthly.

How it works

From index selection to a finished exhibit, without leaving the platform.

Five tools sit on top of every index product. Each one reads the same catalogue the Excel add-in and the API serve.

01 — CURATED VIEWS

Prepared pages for every market and thematic index.

Each index universe opens on a fixed set of pages: Performance, Index Value, Expected Returns, TICCS® or PECCS® Allocation, TICCS® or PECCS® Contribution and, for market indices, Index Regulation. Indices are chosen in a faceted finder that filters by theme, geography, currency and weighting.
Performance: index price, total, capital and income returns, volatility, Sharpe ratio and maximum drawdown.
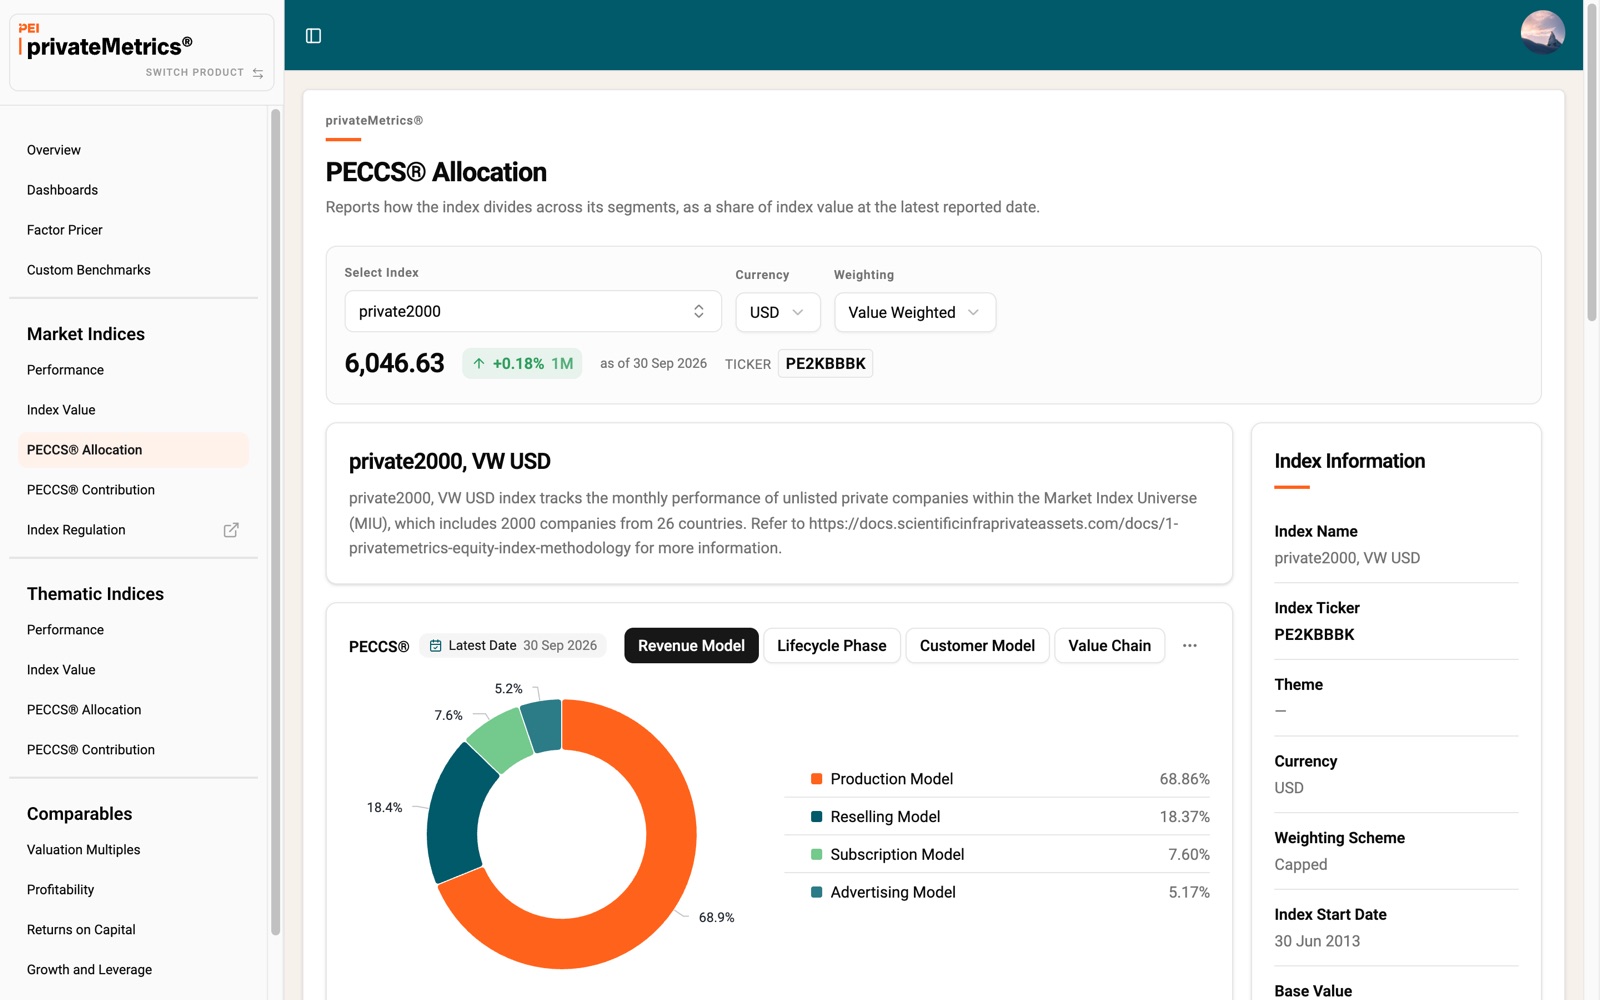
Allocation and Contribution: index weight and return contribution by TICCS® superclass or PECCS® activity class.
The selected index applies to every page in the same universe, and each page URL identifies the index shown.
infraMetrics®infraMetrics® DebtprivateMetrics®
pei.private-alpha.com/privatemetrics/segment-allocation
privateMetrics® PECCS® Allocation page for private2000, with the revenue-model breakdown and index information
02 — DASHBOARDS

Saved boards combining metrics from any index or segment.

A dashboard is a grid of resizable cards. Each card holds one metric for up to six indices or Comparables segments, drawn from three catalogues: market indices, thematic indices and Comparables. Boards are saved to the account, can start from a preset and are shared by link.
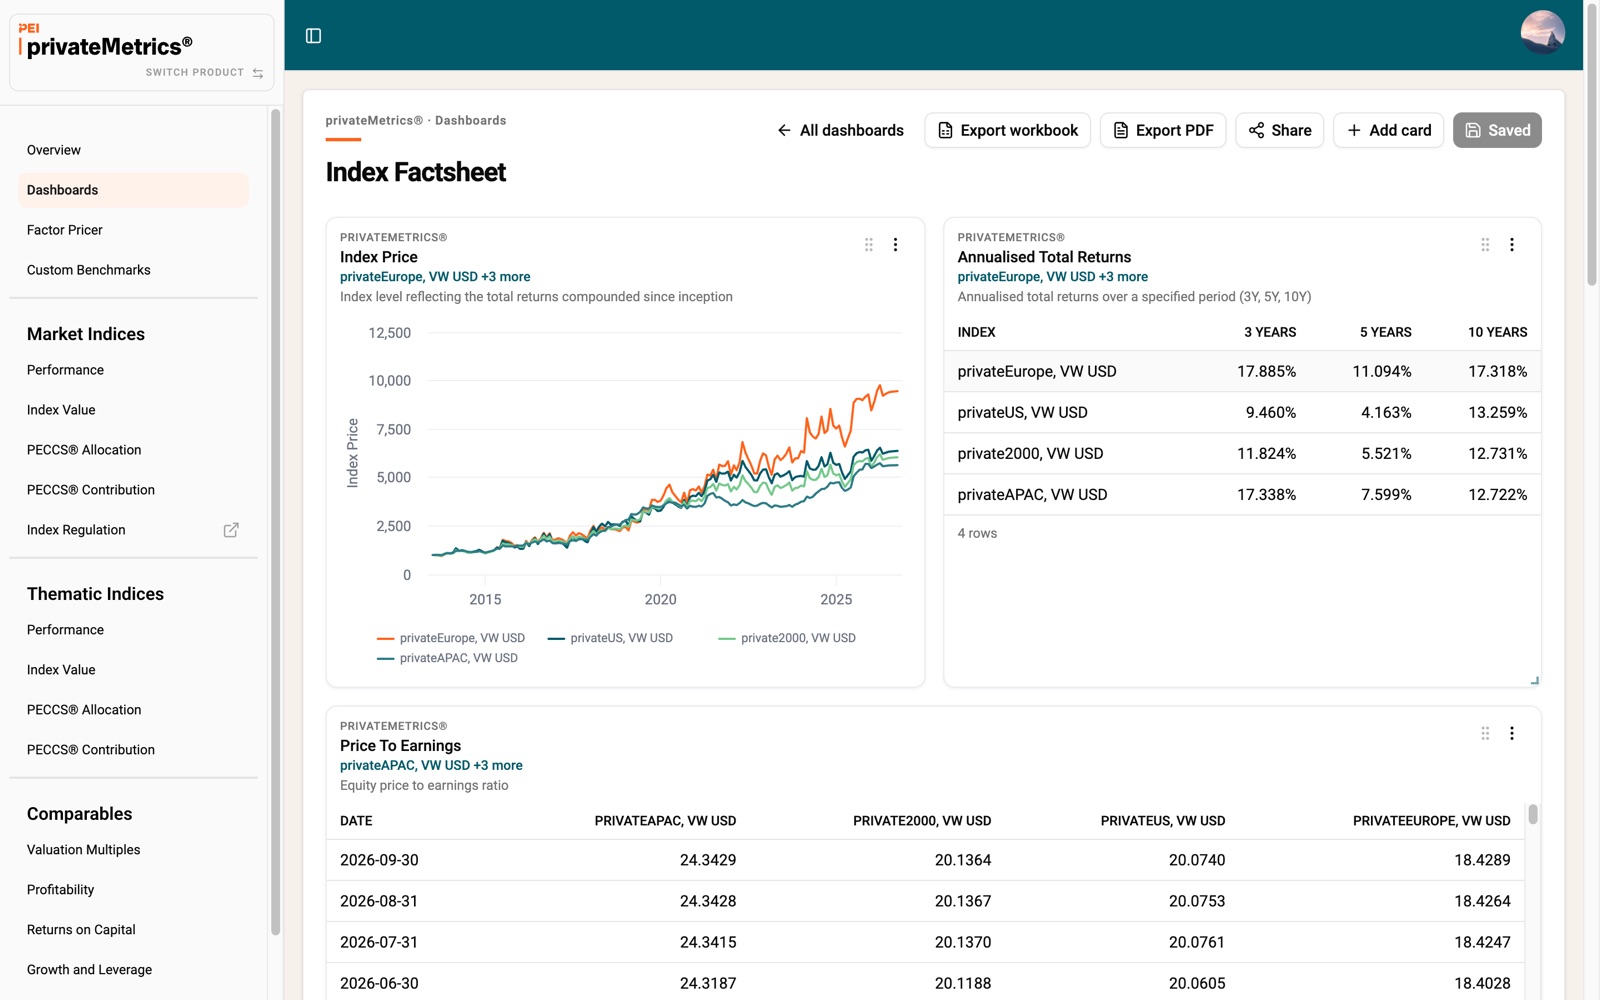
Chart types: line, bar, donut and table, switchable on each card.
Comparables cards: valuation buckets by segmentation and time window, and statistics by period (median, mean).
Shared boards: saving a board received by link creates a copy and leaves the original unchanged.
infraMetrics®infraMetrics® DebtprivateMetrics®
pei.private-alpha.com/privatemetrics/dashboards/[board]
A saved privateMetrics® dashboard combining an index price chart, annualised total returns and price-to-earnings cards
03 — EXPORTING

Export any card as data or as a chart image.

Any chart or table leaves the platform in the format the next step needs: a spreadsheet for further modelling, or a titled chart image ready for an investment committee pack or a client report.
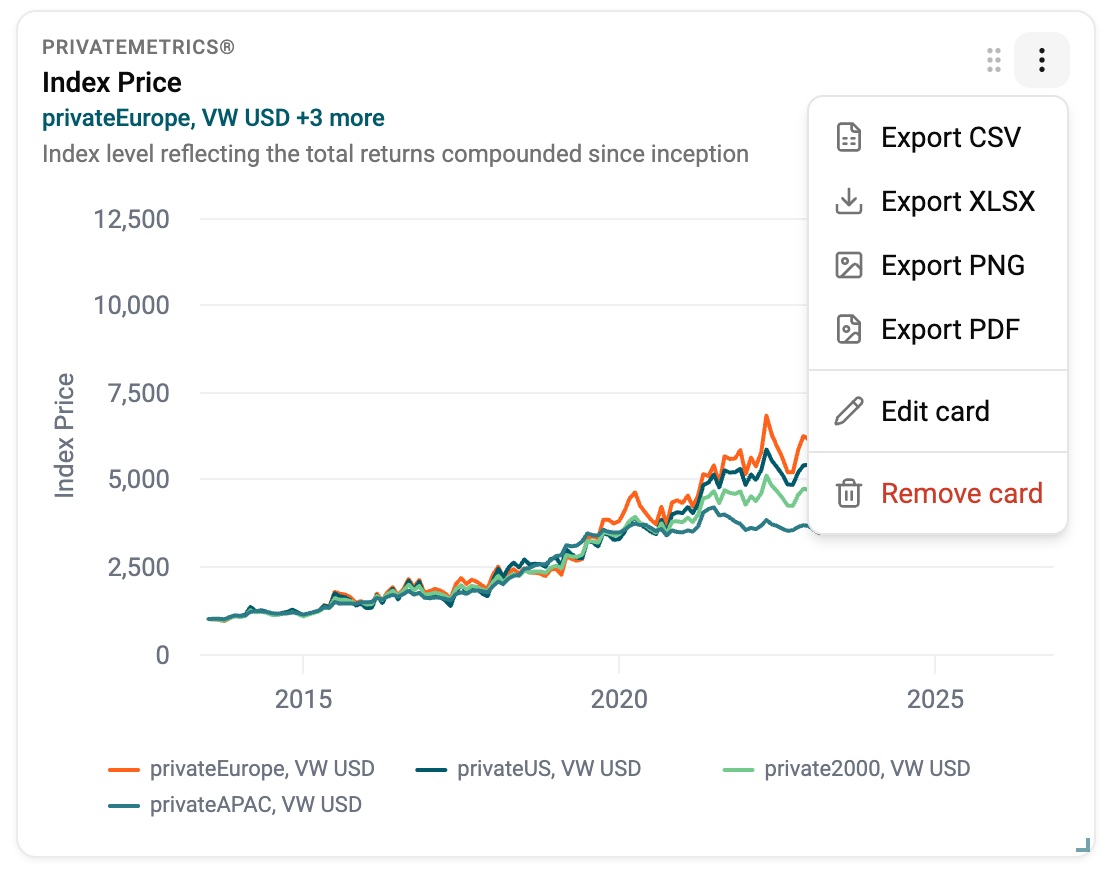
Take the underlying data into Excel, or any tool that reads CSV, ready to model.
Place charts straight into decks and reports — each image carries its title and definition, so it reads on its own.
Export from wherever the chart lives: curated pages, dashboards and Comparables.
CSVXLSXPNGChart PDF
Card options menu on a dashboard's Index Price card, offering Export CSV, XLSX, PNG and PDF
04 — CUSTOM BENCHMARKS

Constrain an index to the mandate it is measuring.

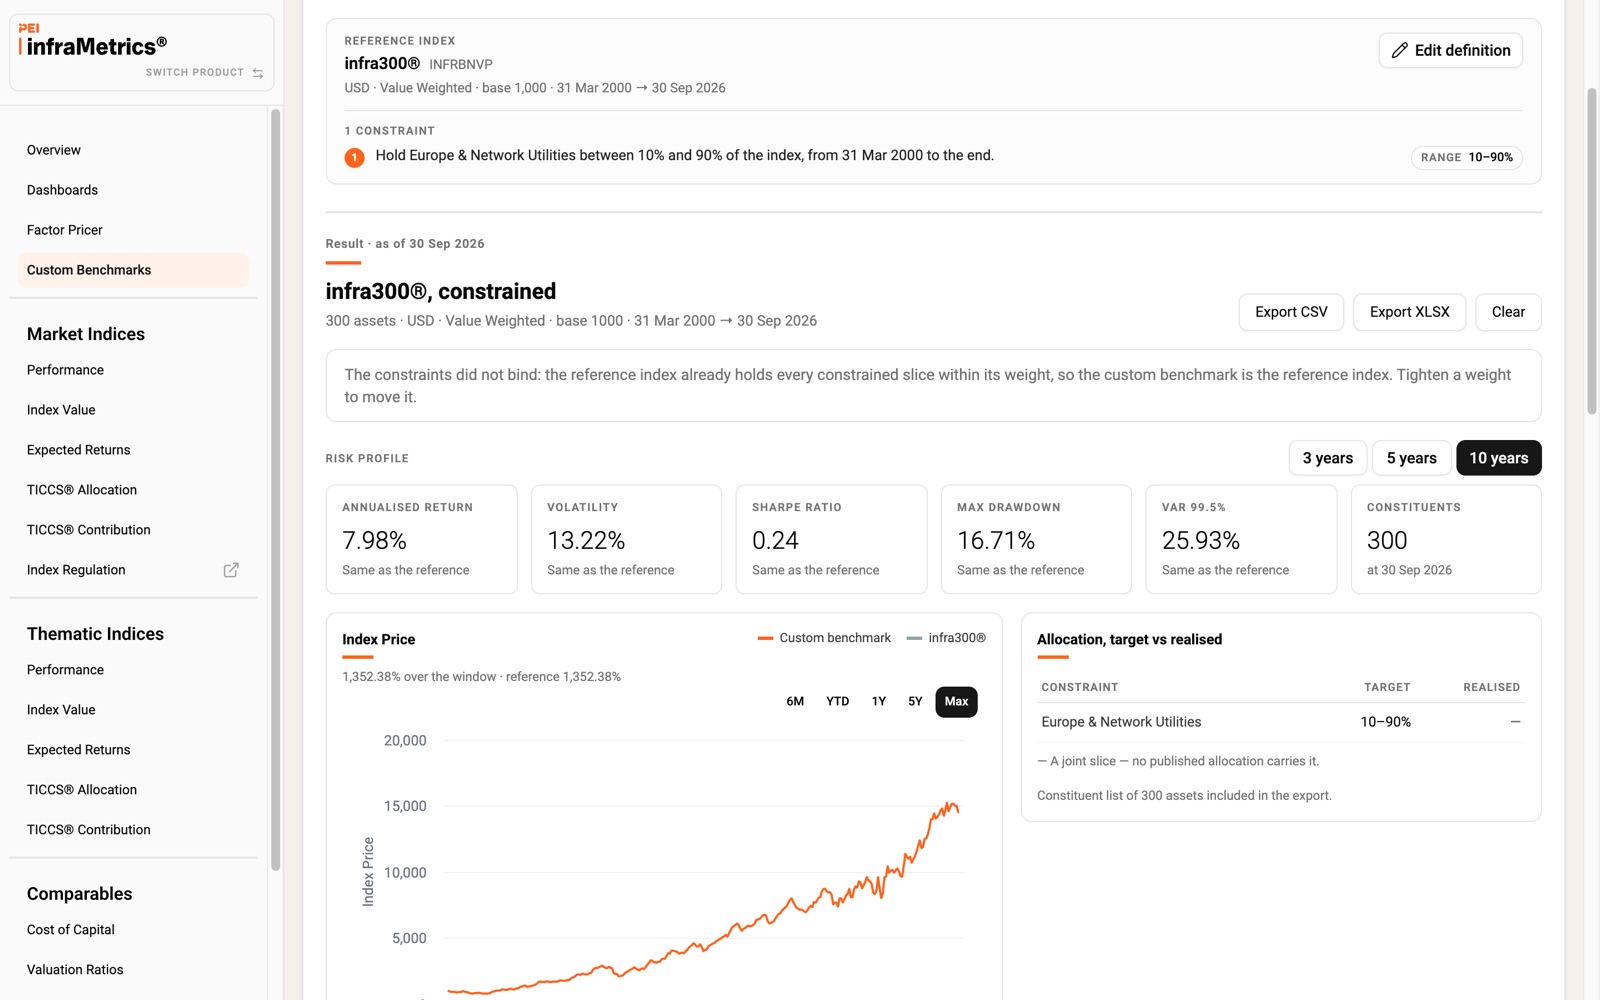
Start from a market index, set weight ranges by geography and by TICCS® or PECCS® segment, and date each set of constraints. Data coverage updates as rows change, and the result is drawn against the same index computed without constraints.
Constituent counts per month before anything is computed.
Allocation and constituents for the result, exportable.
The definition lives in the link — bookmark it, send it, rerun it.
infraMetrics®infraMetrics® DebtprivateMetrics®
pei.private-alpha.com/inframetrics/custom-benchmarks?b=…
infraMetrics® Custom Benchmarks result: infra300® with a Europe and Network Utilities constraint, risk profile and index price
05 — FACTOR PRICER

Price a single asset against the factor model.

Describe an asset — size, leverage, profitability, investment, sector and business model — and receive its risk premium, credit spread or credit risk, with a 50% band and the benchmark rate it was priced against. The same specifications the Excel add-in calls.
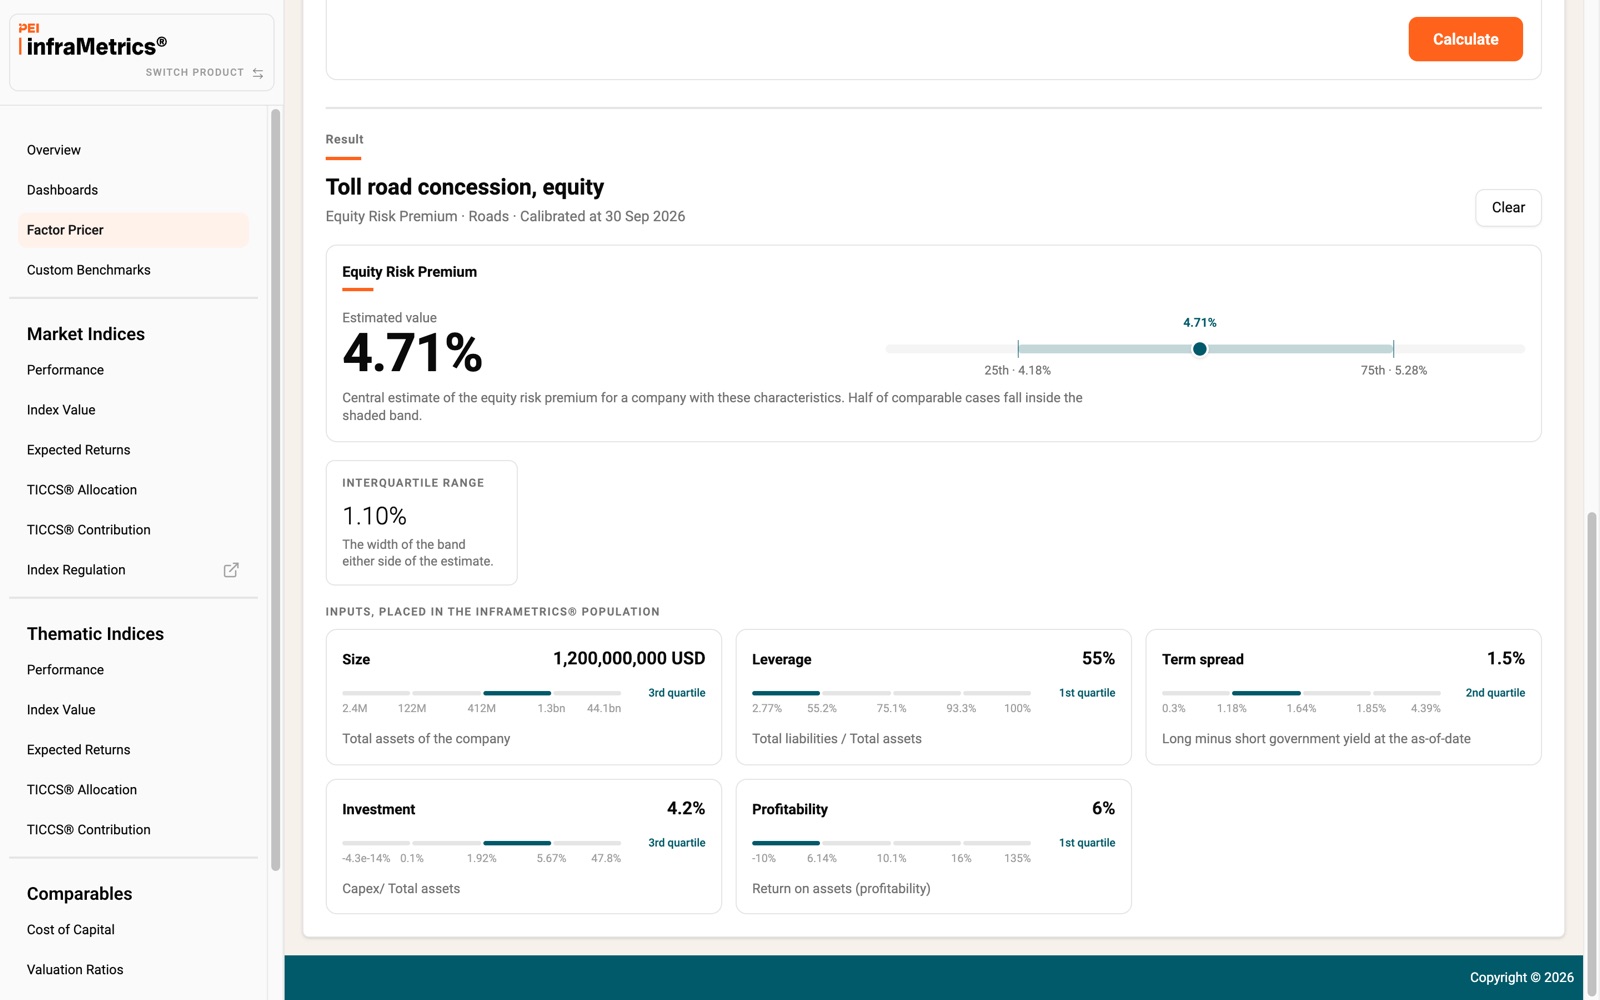
Each input shows which quartile of the universe it falls in.
Risk Premium on equity; Credit Spread and Credit Risk on debt.
A worked example loads in one click.
infraMetrics®infraMetrics® Debt
pei.private-alpha.com/inframetrics/factor-pricer
infraMetrics® Factor Pricer result for a toll road concession, with the estimated equity risk premium and its inputs placed in the population

Product showcase

Three index products, one way of working.

Each index product publishes market indices, thematic indices and Comparables from the same asset-level data. Select a product to see what it covers.

infraMetrics®

Unlisted infrastructure equity, repriced every month.

Benchmarks for performance reporting and mandate design, thematic indices cut along every TICCS® pillar, and valuation comparables for pricing a single asset. History from 2000.
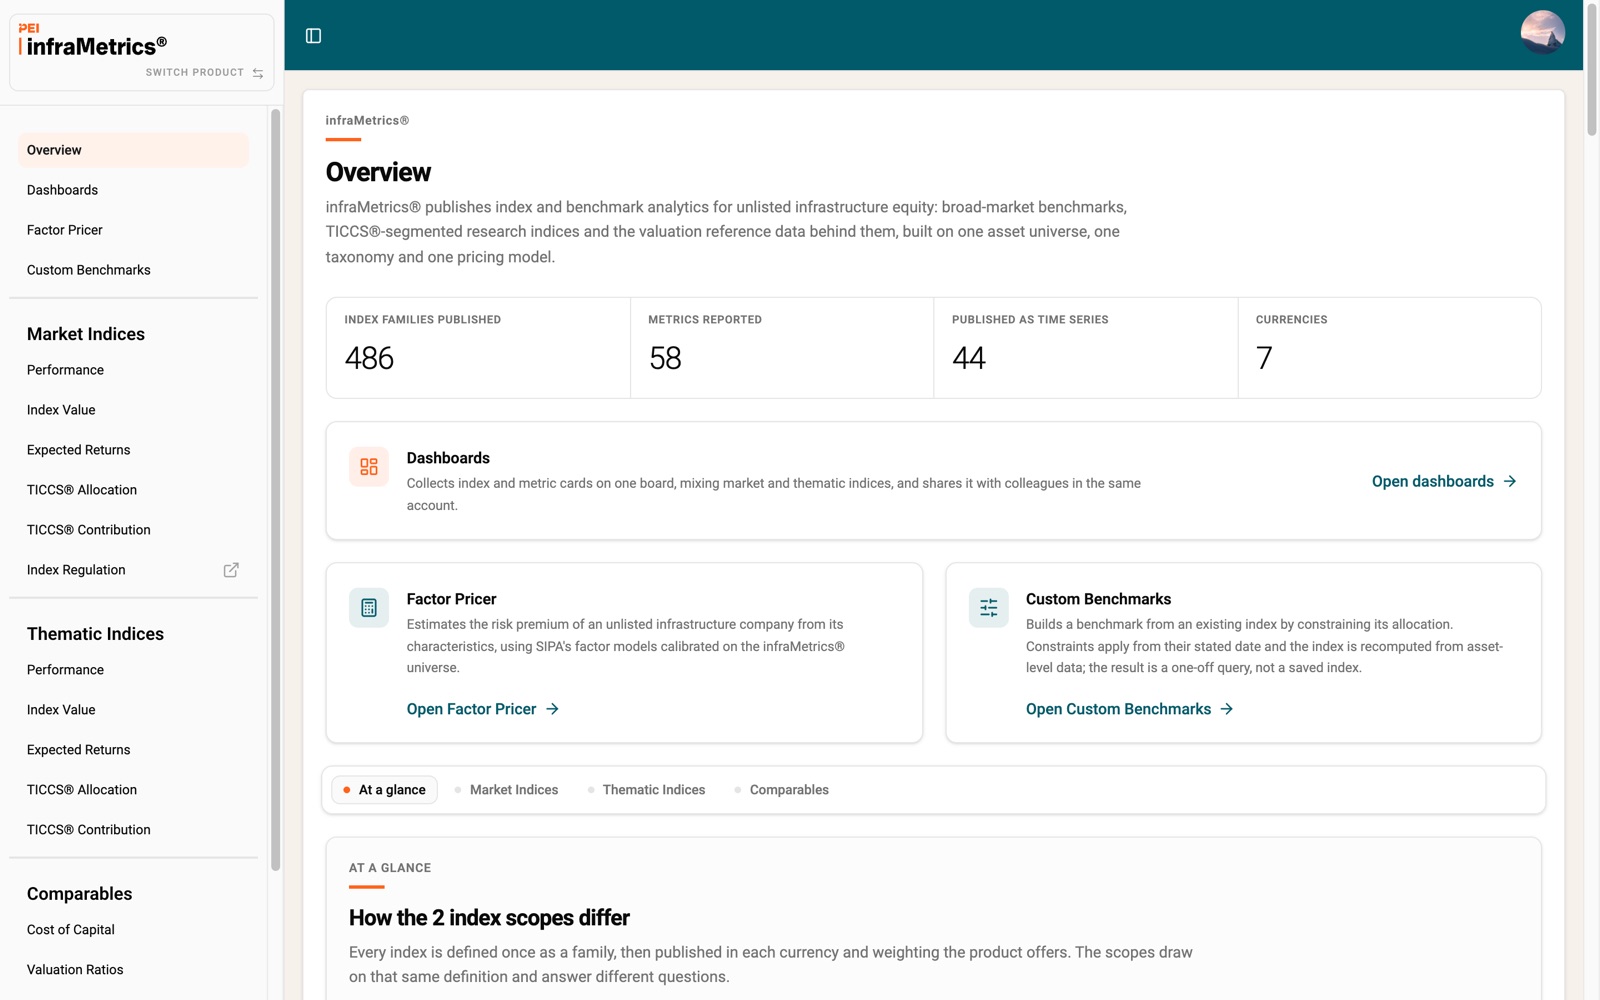
Market indicesinfra300®, Infra100 Global, Global Green Infrastructure
18
Thematic indicesBy industrial activity, business model, corporate structure, style and asset age
428
ComparablesPeer buckets for cost of capital, multiples and risk
459
Total returnsVolatility & VaRExpected returnsWACCEV/EBITDAFive-factor model
Explore infraMetrics® →
pei.private-alpha.com/inframetrics/overview
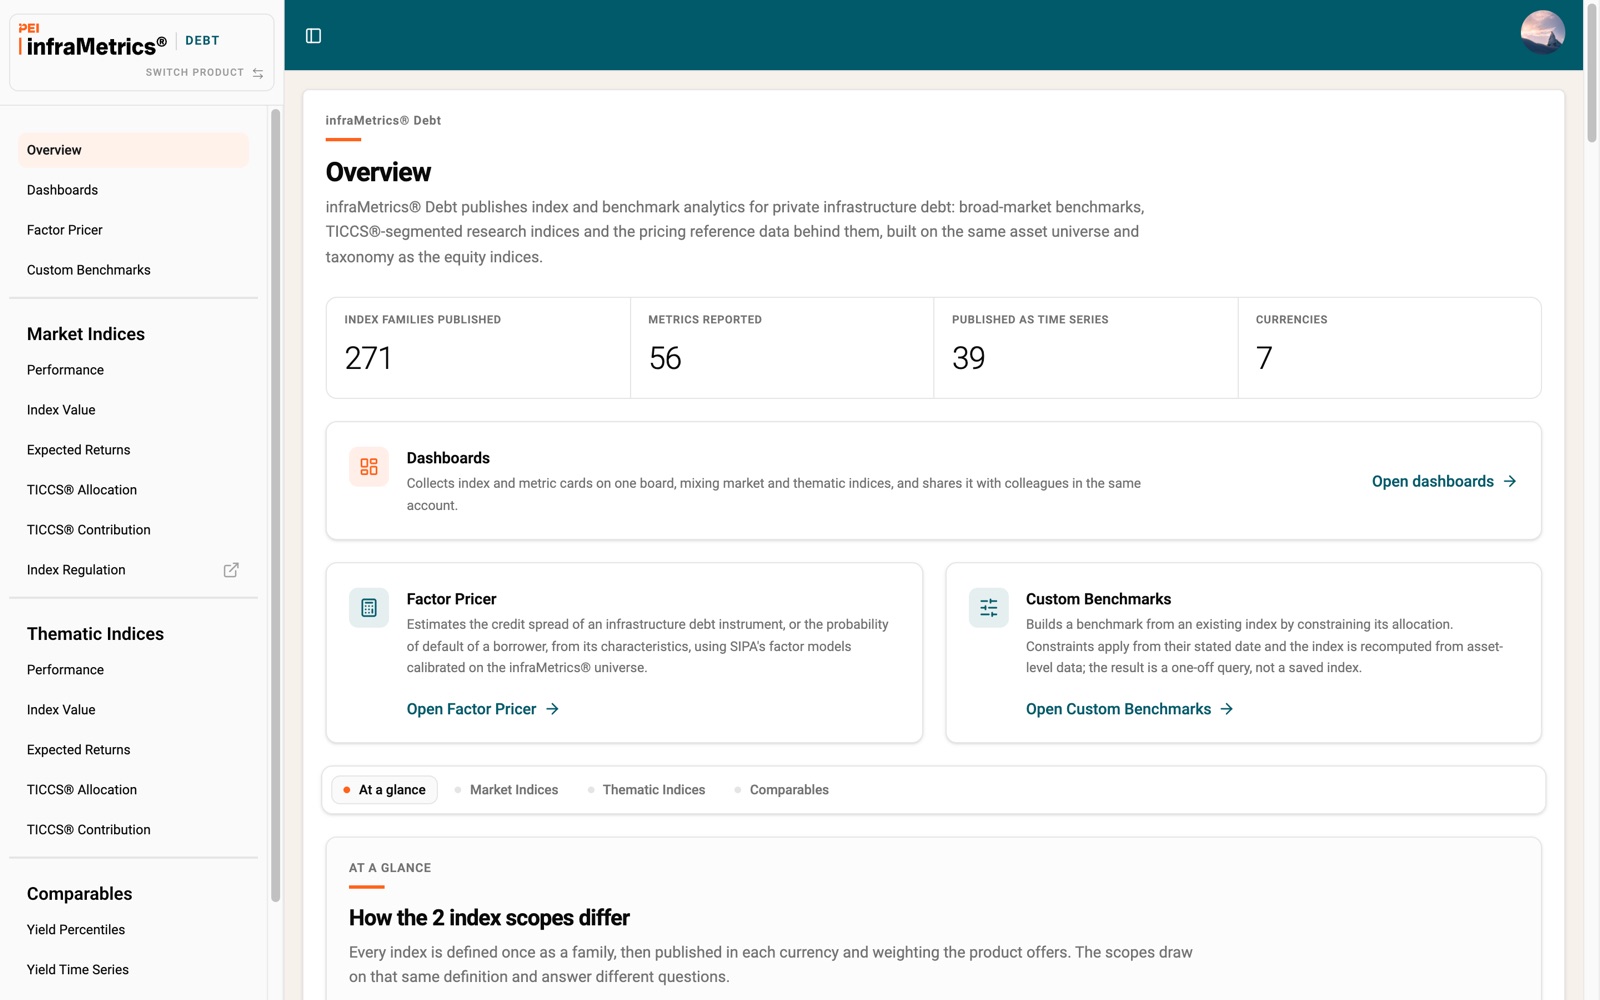
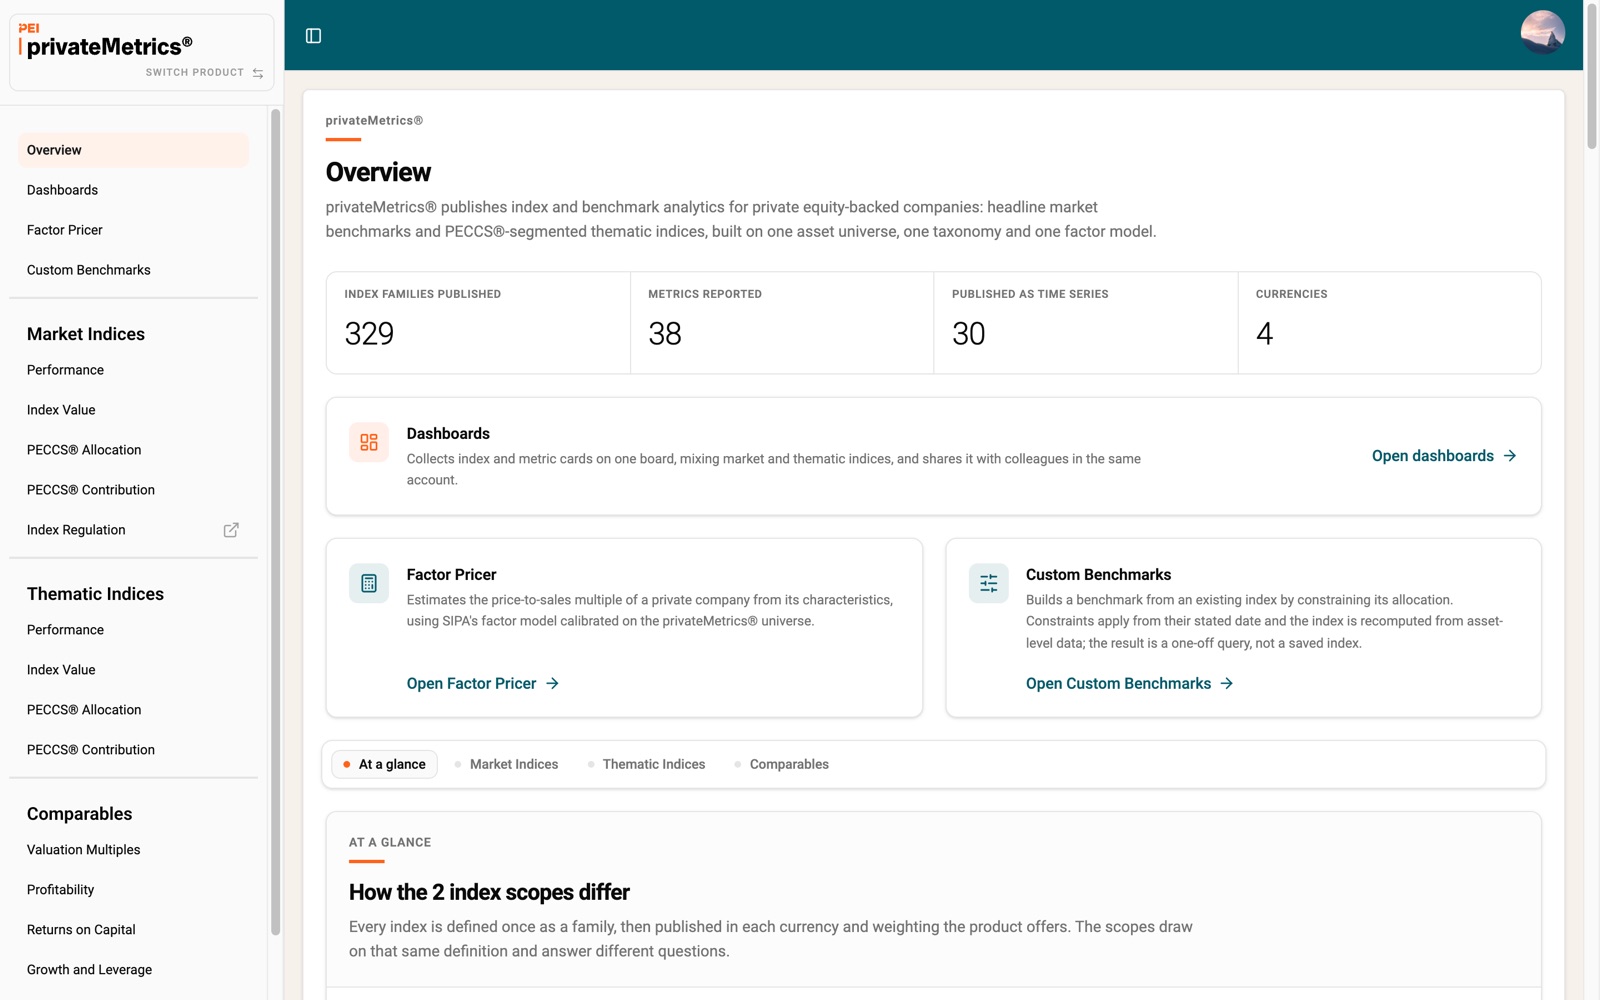
infraMetrics® overview page with index families, metrics and the Dashboards, Factor Pricer and Custom Benchmarks tools
privateAlpha™

Identify the fund managers who beat the market.


Funds and GPs scored by the Direct Alpha Method (Gredil, Griffiths & Stucke, 2023): every cash flow restated at the market return from the date it occurred, against SIPA's ESMA-registered indices — infra300® for infrastructure, private2000® for buyout.

Total Alpha
Return above the broad market.

Measured against infra300® or private2000®, recalibrated monthly from private market transaction data.

Allocation Alpha
Return from where the fund invested.

Total Alpha less Pure Alpha: the contribution of sector, geography and strategy choices.

Pure Alpha · ranked
Return from manager skill.

Against a benchmark matched to the fund's declared strategy, sector and region — the measure every ranking is built on.

MODULE 01 Fund & GP Rankings 1–5 star ranking by average fund alpha; GP rank weighted by DPI/TVPI; filters by vintage, strategy, geography and peer group.
MODULE 02 Fund Profiles Peer-group alpha ranking, return sources separated from alpha sources, realised versus appraisal-held alpha.
MODULE 03 GP Profiles Alpha across vintages, GP Style Boxes, persistence probabilities and skill scores for re-up decisions.
Read the methodology →

Free Pro tier for qualifying institutional investors. 2013–2024 vintages.
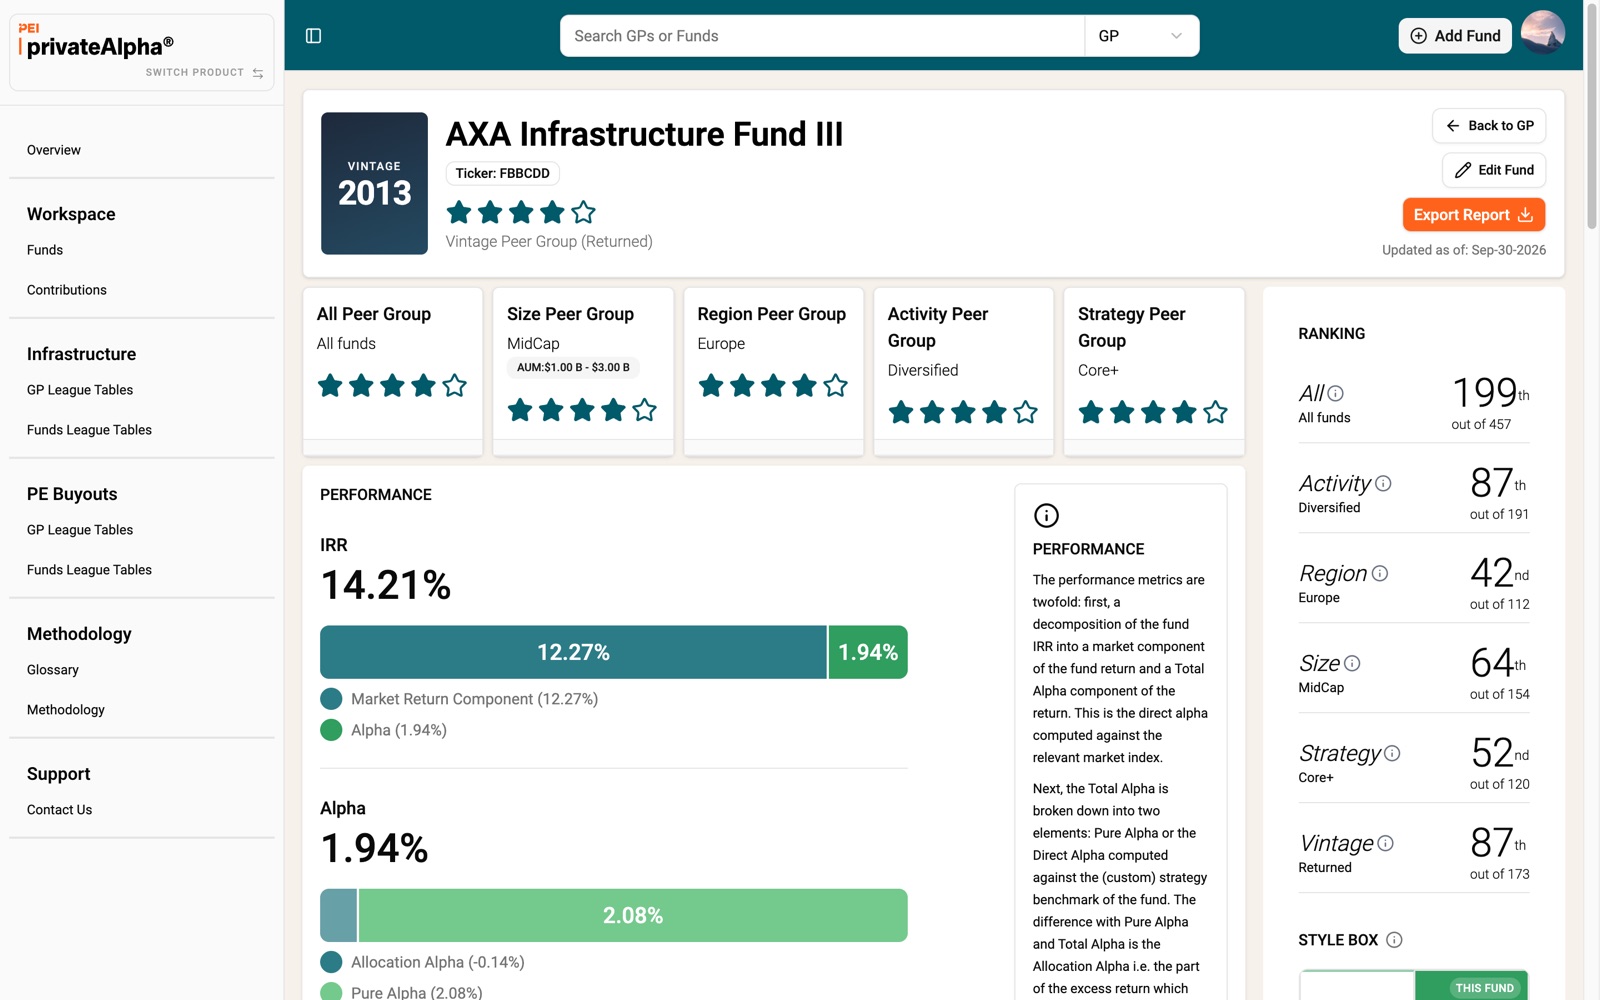
pei.private-alpha.com/privatealpha/fund/pi/FBBCDD
privateAlpha™ fund profile for AXA Infrastructure Fund III, with peer-group ratings, IRR split into market return and alpha, and rankings

privateAlpha™ fund profile — product screenshot.

Solutions

Data for every stage of the investment process.

Asset owners

Benchmark private infrastructure and equity allocations against ESMA-recognized independent indices. Build defensible capital market assumptions, compute factor exposures, and report risk with monthly updated data.

Consultants & data vendors

Integrate 10,700+ SIPA indices and the full comparables database via REST API, Python, and R. Embed monthly-updated private asset pricing, factor exposures, and shadow credit ratings into client reporting platforms.

By use case

Data delivery

The same numbers, wherever the model lives.

The platform is one way in. The indices, metrics, factor pricer and custom benchmarks behind it are served to spreadsheets, code and data warehouses from the same catalogue.

Web platform
Every product in one interface, updated monthly.
pei.private-alpha.com
Excel Add-in
Custom functions for indices, alpha, factor pricing and custom benchmarks.
Microsoft AppSource →
REST API
Catalogues, metrics and compute endpoints over HTTPS.
docs.sipametrics.com →
Python package
An async client over the REST API, published on PyPI.
pip install sipametrics →
SFTP
Index files delivered on the monthly release schedule.
Scheduled files
Read the documentation →
# pip install sipametrics
from sipametrics import SipaMetricsService
import sipametrics.constants as CONSTANTS

async with SipaMetricsService(client_id='your_client_id', secret_key='secret_key') as service:
    response = await service.indices_catalogue(
        product=CONSTANTS.Product.PRIVATE_INFRA,
        app=CONSTANTS.App.MARKET_INDICES,
    )

Trusted by

The institutions setting the private markets standard.

Asset managers

  • Amundi
  • BlackRock
  • Goldman Sachs Asset Management
  • Neuberger Berman

Asset owners

  • AustralianSuper
  • CalPERS
  • NN Investment Partners
  • PGGM
  • TIAA

Consultants & services

  • FactSet
  • Mercer
  • Moody's Analytics
  • ORTEC Finance
  • Prodatix
  • StepStone

Why SIPA

Benchmarks built from asset-level private market data.


SIPA — Scientific Infra & Private Assets, part of PEI — prices private companies from transaction data every month and publishes the results as regulated indices, comparables and fund scores.

ESMA
Registered administrator
SIPA is a registered market-benchmark administrator in the EU.
~1M
Companies priced monthly
Every constituent repriced each month from the latest private market data.
2
Open taxonomies
TICCS® for infrastructure and PECCS® for private companies classify every constituent.
USD25M+
Research investment
A decade of R&D, rooted in academic research at EDHEC.

Academic research foundation

Built on two decades of private markets research.

SIPA data and technology originated at EDHEC, a leading academic research centre and business school. SIPA is built upon 10 years of work on private asset pricing, risk factors, and performance measurement.

SIPA Indices & benchmarks are the product of scientific methodologies. Every pricing model is peer-reviewed and published by an international research team. SIPA benchmarks are registered with the European Securities and Markets Authority (ESMA) for use in regulated financial products.

SIPA uses the TICCS® and PECCS®, two classification systems for private assets adopted by leading investors worldwide.

Double academic & industry validation ESMA-registered
Indices, comparables and fund alpha. All in one platform.
Open it with your SIPAmetrics account, or start benchmarking your private asset portfolio with a demo.
Request a demo Open platform